

| Journal of Endocrinology and Metabolism, ISSN 1923-2861 print, 1923-287X online, Open Access |
| Article copyright, the authors; Journal compilation copyright, J Endocrinol Metab and Elmer Press Inc |
| Journal website http://www.jofem.org |
Original Article
Volume 7, Number 1, February 2017, pages 18-24
The Impact of Diabetes Mellitus on Oxygen Utilization by Complex IV: Preliminary Insights
Denyse P. Fridaya, Trevor A. Alleyneb, d, Diane N. Ignaciob, Dunstan Arrindellb, Suresh R. Raoa, George Legallc
aAnatomy Unit, Department of Preclinical Sciences, Faculty of Medical Sciences, The University of the West Indies, St. Augustine Campus, Trinidad and Tobago
bBiochemistry Unit, Department of Preclinical Sciences, Faculty of Medical Sciences, The University of the West Indies, St. Augustine Campus, Trinidad and Tobago
cCommunity Health Unit, Department of Paraclinical Sciences, Faculty of Medical Sciences, The University of the West Indies, St. Augustine Campus, Trinidad and Tobago
dCorresponding Author: Trevor Alleyne, Department of Preclinical Sciences, Faculty of Medical Sciences, The University of the West Indies, Eric Williams Medical Sciences Complex, Uriah Butler Highway, Champs Fleurs, Trinidad and Tobago
Manuscript accepted for publication October 10, 2017
Short title: Impact of Diabetes on Complex IV Activity
doi: https://doi.org/10.14740/jem375w
| Abstract | ▴Top |
Background: The protein complexes of the electron transport chain have been linked to the pathogenesis of diabetes mellitus (DM), but the interplay between DM and cytochrome c oxidase (complex IV) is not well understood. In this study, using a rat DM model, we evaluated the effect of DM on liver and kidney mitochondria, looking specifically at the characteristics of oxygen consumption by complex IV; we also studied the effects of DM on the protein composition of liver and kidney mitochondria.
Methods: One hundred eighty rats, 60 at a time, were divided into two equal groups and diabetes induced in one group by intraperitoneal injection of streptozotocin 45 mg/kg. One-third of each group was sacrificed at 1 month intervals and mitochondria were isolated from the liver and kidney. Using the mitochondria isolated, the rate of oxygen consumption by complex IV was compared for the DM and control rats by use of polarographic assay. In addition, the protein composition of liver and kidney mitochondria of the DM and control rats was compared by SDS-PAGE.
Results: The study found that for mitochondria from the DM liver, the characteristic biphasic pattern of oxygen consumption disappeared after 1 month, was restored after 2 months but disappeared again by the end of 3 months. The mitochondria from the kidney showed decreased activity but retained its biphasic nature until the end of 3 months. In addition, the study found that compared to the controls, mitochondria from both the liver and kidney of the diabetic rats showed alterations to the distribution of medium and low molecular weight proteins.
Conclusions: The results suggest that in uncontrolled diabetes, critical adverse alterations to liver mitochondria may occur quite early. It seems that initially the body might be able to compensate for these changes but the compensation is temporary.
Keywords: Diabetes; Complex IV inhibition; Liver mitochondria; Oxygen utilization; Protein
| Introduction | ▴Top |
Diabetes mellitus (DM) is an incurable endocrine disorder that is characterized by persistent hyperglycemia [1] and numerous long-term microvascular and macrovascular health complications [2-5]. According to estimates from the World Health Organization and the International Diabetes Federation [6, 7], somewhere between 300 and 400 million persons worldwide, will be diagnosed with the disease by the year 2035.
Although DM is divided into two major types, type 1 and type 2, reactive oxygen species (ROS), leading to oxidative stress, have emerged as a common link in the complications associated with the disease [8-11]. The electron transport chain which is located in the inner membrane of mitochondria comprises, among other things, four protein complexes [12, 13]. The chain carries out a stepwise oxidation of consumed food in the first of two stages of oxidative phosphorylation [14]. The final step of oxidation by the chain occurs at complex IV (cytochrome c oxidase) where oxygen taken in during inspiration is reduced to water [15, 16]. Studies have shown that ROS generated at complexes I and III of the electron transport chain contribute to the pathogenesis of diabetes [17, 18]. Other studies [19] have shown that in the diabetic state, mitochondrial proteins are altered and complex IV has decreased activity. It is not clear however, if the altered activity of cytochrome c oxidase results from a decreased concentration of the complex or if this enzyme is inhibited and if so, what category of inhibition might be involved. Also details of the altered mitochondrial proteins are still to emerge.
COX (complex IV) is the terminal enzyme in cellular respiration [14]. Whereas the bacterial forms have only 3 - 4 subunits and are monomeric, mammalian COX contains 7 - 13 subunits and is dimeric (Fig. 1a, b) [20, 21]. Of the 13 subunits found in mammalian COX, subunits I, II and III are the largest and are transmembrane while other subunits are mainly towards one side or the other of the membrane (Fig. 1a) [21]. The enzyme also contains three redox active coppers, two redox active hemes, one magnesium, one zinc, one calcium and one sodium ion per monomer [21].
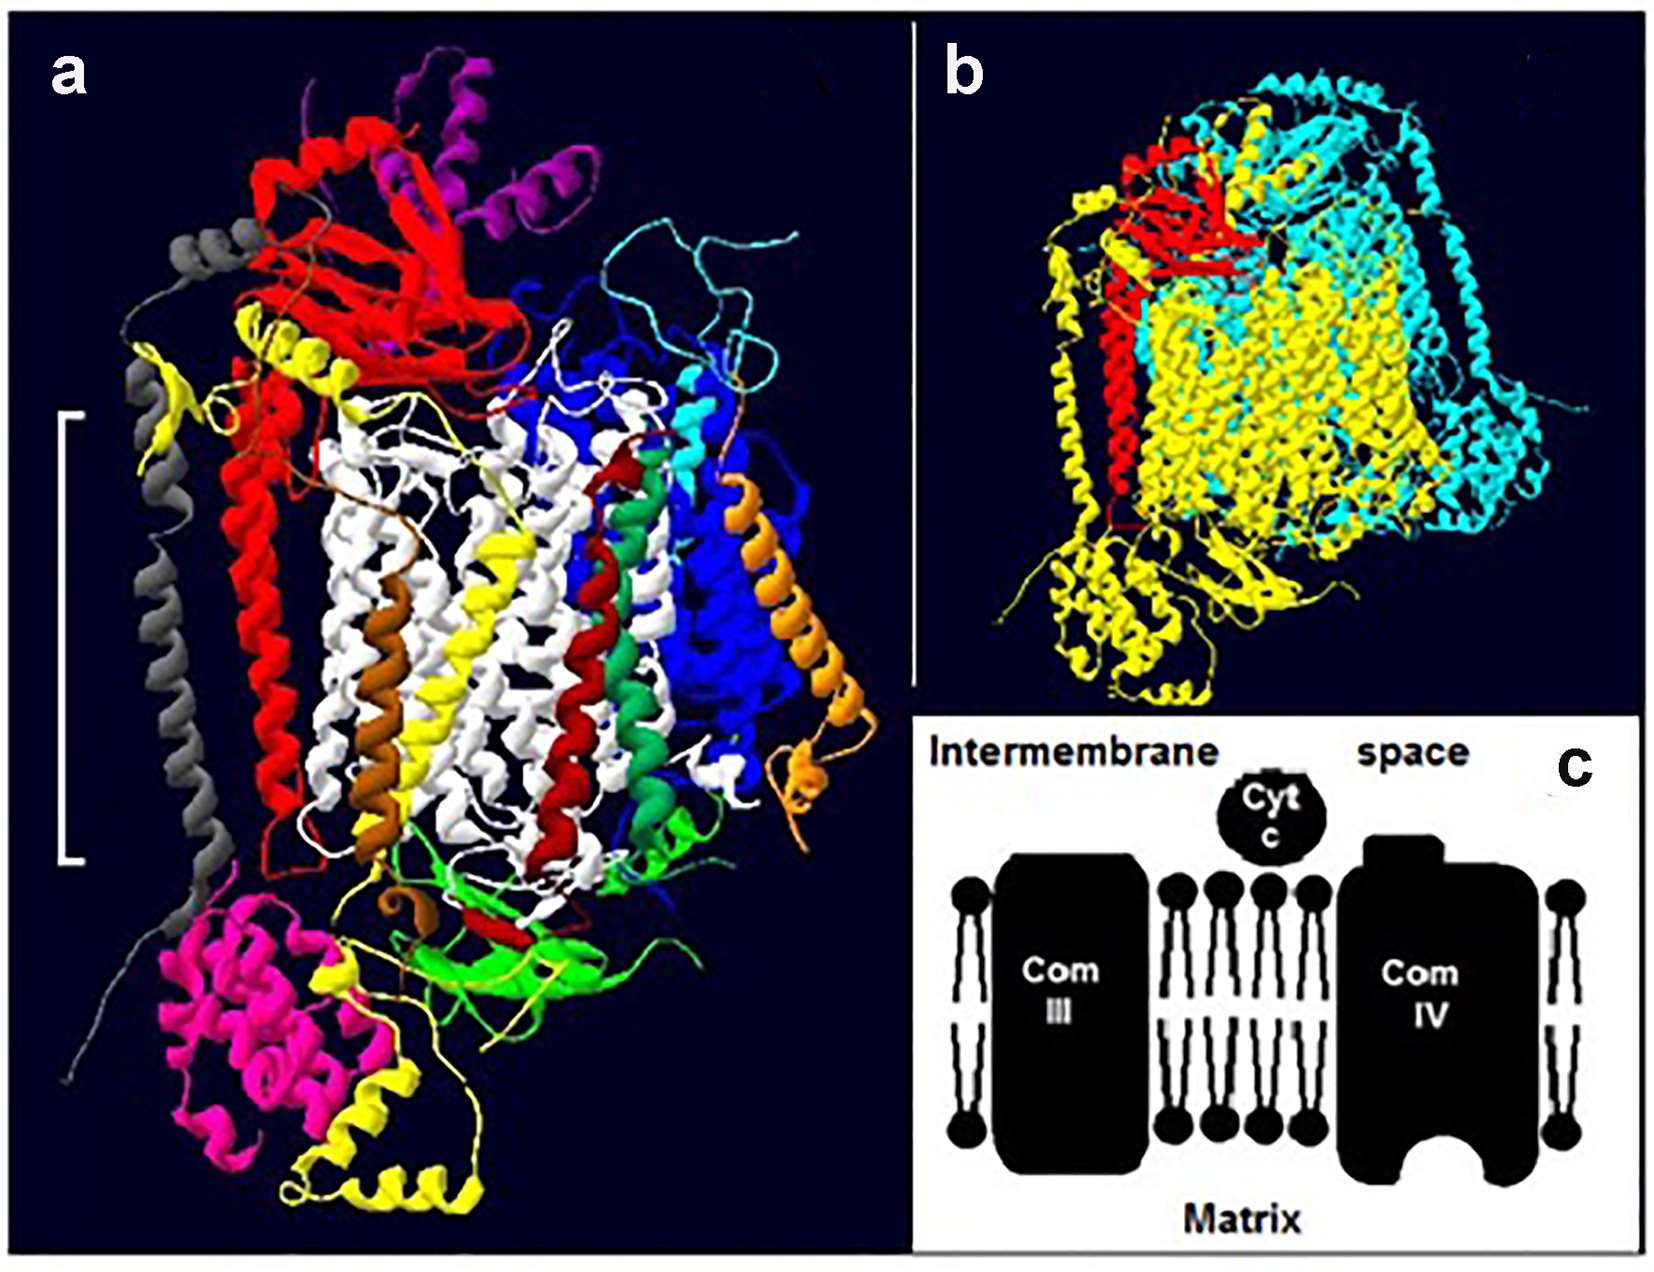 Click for large image | Figure 1. Cytochrome c oxidase. (a) The 13 subunits of one monomer of bovine COX (22): subunit, I (white), II (red) and III (blue) IV (yellow), V (pink), VI (green; extra-membrane) VII (light blue), VIII (purple), IX (gray), X (orange), XI (brown), XII (dark green) and XIII (dark brown). The white bracket shows the approximate position of the membrane. (b) A typical dimer (two identical monomers) of mammalian COX. One monomer is colored yellow and the other light blue; for ease of reference subunit II of the former is shown in red. The structures in both “a” and “b” are tilted slightly. (c) A section of the electron transport chain showing complexes III and IV. Cytochrome c (cty c) picks up electrons from complex III and delivers them to complex IV. |
Electrons enter the enzyme via an extra-membrane protrusion on the cytosolic side of subunit II (Fig. 1a, c), and travel to oxygen via the redox active metals [22, 23]. The kinetics of oxygen reduction by complex IV have been extensively studied but the interpretation of the data lacks consensus. Interpretations include a complex IV with: 1) two active substrate binding sites; 2) one active and one regulatory site; and 3) a single site that undergoes conformational changes [24-26]. The question we asked here is, how exactly does DM alter the kinetics of complex IV and could this be linked to reports of DM-induced structural alterations of mitochondrial proteins [19]?
To answer this question, DM was induced in rats and mitochondria were isolated from the liver and kidney of these diabetic animals. As a control, mitochondria were also isolated from non-diabetic rats. The kinetics of oxygen consumption and the protein composition of the mitochondria from the diabetic and control rats were compared.
| Methods | ▴Top |
Permission to conduct the study was obtained from the Ethics Committee of the Faculty of Medical Sciences, UWI. A total of 180 rats were studied. All animals were maintained under a 12 h day light environment. Three animals were housed in each cage and food and water were given ad libitum. The food took the form of commercial rabbit pellets.
The experiments were repeated three times using groups of 60 rats. Following an overnight fast, each of the sixty rats was weighed and had its blood glucose level measured after which the rats were divided into two equal groups. Streptozotocin, 45 mg/mL was prepared in 0.01 M citrate buffer pH 7.0. DM was induced in one cohort by a single intraperitoneal injection of streptozotocin, 45 mg/kg, as previously described [27]. Control rats were injected with corresponding volumes of the 0.01 M citrate buffer, and monitored daily, using a commercial glucometer, while their body weight was monitored weekly. Diabetic and control rats were sacrificed at the end of three time periods; 1, 2 and 3 months. Approximately one-third of all liver and kidney tissue was set aside for histological analysis and the remainder were used for the preparation of mitochondria for biochemical studies. Normally the liver tissue and similarly the kidney tissue from three to five animals in a particular group would be combined prior to commencing the isolation of mitochondria. Mitochondria were extracted from the liver and kidney tissue by acid precipitation as described previously [28, 29] and stored at -20 °C until needed; kinetic studies were normally performed within 48 h of storage.
Polarographic assay
The rate of oxygen consumption of the mitochondria isolated from diabetic and control rats was determined by polarograhic assay as described elsewhere [24, 28]. The final mitochondrial concentration was 2 mg/mL and the concentration of cytochrome c (the substrate) ranged from 6.8 to 680 μM; a small volume of buffer was added as necessary to maintain a fixed reaction volume of 3.0 mL.
Stock mitochondrial suspension (250 μL) was added to 25 mM tris acetate buffer, pH 7.4 (2.5 mL) in the reaction chamber and allowed to reach the steady temperature of 25 °C. Next oxidized cytochrome c was added and background activity was recorded for 1 min. Finally, the reaction was started by adding 100 μL of the reducing agent, an ascorbate/TMPD mixture (500 mM:50 mM) and the rate of oxygen consumption was recorded. For each substrate concentration, the assay was repeated three times. The results were presented in the form of Eadie-Hofstee plots which is standard for COX studies of this type [24]. Eadie-Hofstee plots give a more even spread of data points and with more uniform error bars than the well-known Lineweaver-Burke plot. The extent to which experimental data fitted a single straight line or two intersecting lines [24] was assessed by linear regression analysis.
SDS-PAGE
The protein composition of the mitochondria from the diabetic and control rats was compared by use of SDS-PAGE on 18% gels as described previously [30]. The stained gels were analyzed using absorbance spectroscopy at 710 nm.
Structural studies
The 3D structure of COX [21] was downloaded from the protein data bank and manipulated using the Swiss PDB Viewer program.
| Results | ▴Top |
Polarographic assay of mitochondria
Liver
The polarographic assay of liver mitochondria from control rats, on every occasion, generated Eadie-Hofstee plots with two intersecting straight lines, as reported by others [24]. Figure 2 which typifies the results presents a data set for control and diabetic rats for three repeat assays. Figure 2a shows Vmax values of 2,200 and 4,400 nmol O2/min at the high affinity and low affinity sites, respectively for the control animals at the 1-month time period. The corresponding Km values were 0.6 M × 10-8 at the high affinity site and approximately 2 M × 10-6 at the low affinity site. In the case of the 1 month diabetic rats, however, mitochondria from 75% of these animals gave rise to Eadie-Hofstee plots that were uncharacteristic and did not yield two intersecting straight lines as expected (Fig. 2a and Table 1).
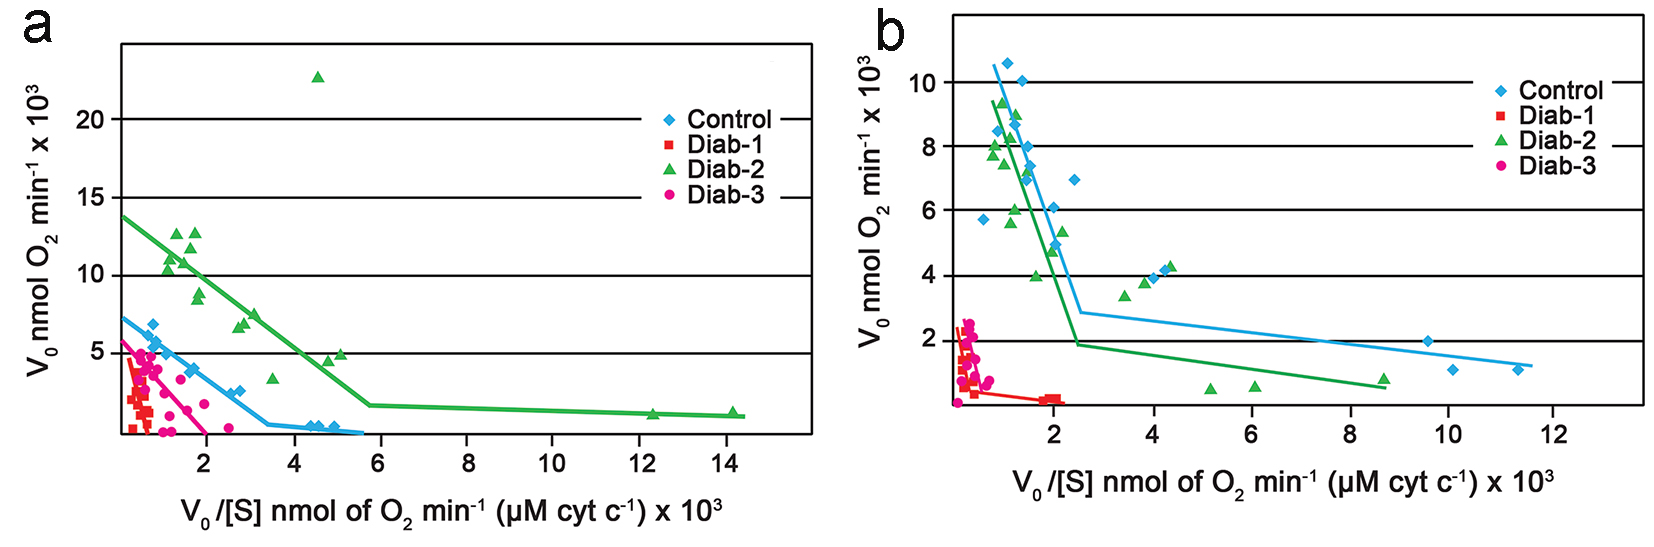 Click for large image | Figure 2. Eadie-Hofstee plots. (a) Eadie-Hofstee plots generated from the polarographic assay of COX within rat liver mitochondria. Typical control (blue). Diabetic at 1 month (red). Diabetic at 2 months (green). Diabetic at 3 months (purple). (b) Eadie-Hofstee plots generated from the polarographic assay of COX within rat kidney mitochondria. Typical control (blue). Diabetic at 1 month (red). Diabetic at 2 months (green). Diabetic at 3 months (purple). For all experiments the final mitochondrial concentration was 0.2 mg/mL; the substrate (cytochrome c) concentration was 6.8 - 680 μM. |
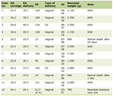 Click to view | Table 1. Summary Km and Vmax for Liver Mitochondria |
Interestingly, it appeared that at the end of 2 months, some degree of normalcy had returned to oxygen utilization by complex IV of the diabetic rats as the mitochondria from the majority the animals, > 70%, produced biphasic plots yielding two Vmax values and two Km values (Fig. 2a); also the corresponding Vmax and Km values were comparable to those produced by the control (Table 1). At the end of 3 months, once again there was a change in the characteristics of the kinetics of the mitochondria from the diabetic rats; once again only one line rather than two intersecting lines and consequently one Vmax was observed (Fig. 2a and Table 1).
Kidney
The kinetic data generated from the polarographic assay of the kidney mitochondria were similar but not identical to those observed for the liver. In the first instance, the kidney mitochondria from the 1 month diabetic rats showed an approximate two to fivefold decrease in Vmax values when compared to the control (Fig. 2b and Table 2). Unlike the case for the liver, however, complex IV of the kidney maintained the characteristic biphasic Eadie-Hofstee plots (Fig. 2b). Again by the end of 2 months there appeared to be full recovery as the Vmax of the control and diabetics were comparable. At the end of the next interval, i.e., 3 months, once again there appeared to be a total shutdown of the high affinity site as once again a single line rather than the expected two intersecting lines, was obtained (Fig. 2b).
Click to view | Table 2. Summary of Km and Vmax for Kidney Mitochondria |
SDS-PAGE
Liver
SDS-PAGE analysis revealed that at the end of 1 month, the protein composition of liver mitochondria from the diabetic rats was somewhat different to the protein composition of mitochondria from the controls. At 1 month in the diabetic, there was an increase in concentration of a low molecular weight (< 15 kd) protein (Fig. 3a, c). After 2 months, in addition to the increase in concentration of the low molecular weight protein, the diabetic rats showed increased intensity of at least one other protein in the medium molecular weight (about 45 kd) region (Fig. 3b, c); there were no further major changes observed at the end of 3 months.
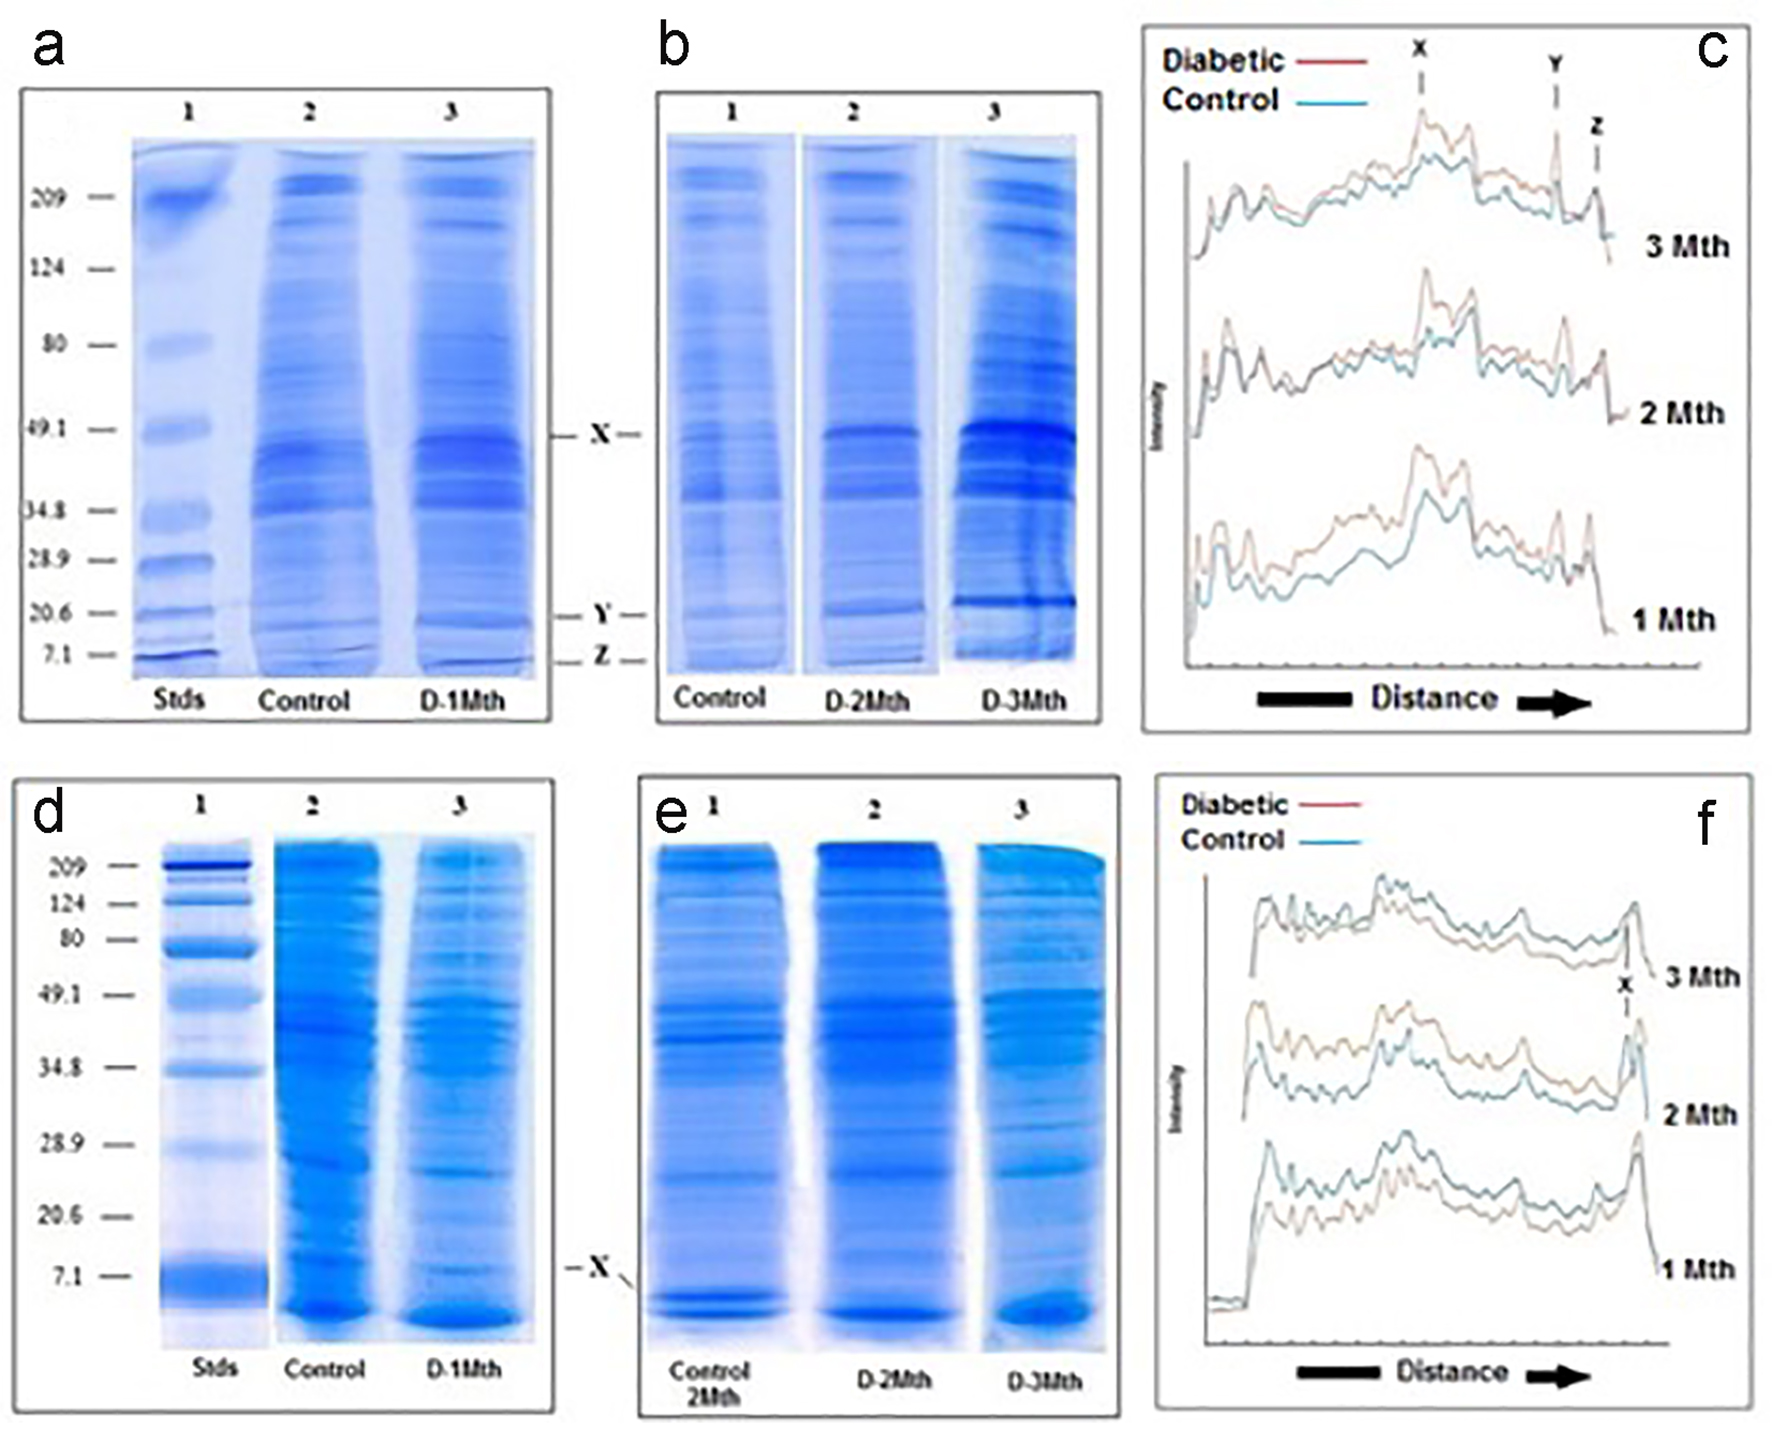 Click for large image | Figure 3. SDS-PAGE of liver and kidney (d-f) mitochondria. (a-c) Liver. SDS-PAGE of mitochondria from control and diabetic rats. (a) Lane 1: molecular weight standards (7.1 - 209 kd); lane 2: control; lane 3: diabetic rats 1 month. (b) Lane 1: control; lane 2: diabetic rats 2 months; lane 3: diabetic rats 3 months. (c) Densitometric analysis of the SDS gels shown in A and B. In all three cases, the blue traces are from the controls and the red are generated from the diabetics. (d-f) Kidney. SDS-PAGE of kidney mitochondria from control and diabetic rats. (d) Lane 1: molecular weight standards (7.1 - 209 kd); lane 2: control; lane 3: diabetic rats 1 month. (e) Lane 1: control; lane 2: diabetic rats 2 months; lane 3: diabetic rats 3 months. (f) Densitometric analysis of the SDS gels shown in (a) and (b). In all three cases, the blue traces are from the controls and the red are generated from the diabetics. |
Kidney
In contrast to what was seen for the liver, analysis of the kidney mitochondria by SDS-PAGE revealed no obvious differences in the protein composition between the diabetics and the controls at the end of 1 month. At 2 months and also 3 months, however, a low molecular weight protein (< 15 kd) seen in the mitochondria of the controls was totally absent in mitochondria derived from diabetic rats (Fig. 3e, f).
| Discussion | ▴Top |
Since 1976, when it was first reported that polarographic assays of complex IV within isolated mitochondria, when conducted under conditions of low ionic strength, yielded Eadie-Hofstee plots with two intersecting straight lines, that approach [24] has become standard for such studies. Our present investigations found that for mitochondria of both the liver and kidney control rats, the Eadie-Hofstee plots generated from the polarographic assays were typically biphasic with Km values of the order of 10-6 and 10-8 M for the low and high affinity “binding sites”, respectively consistent with previous reports [24]. Interestingly, for the controls, the Vmax values at the end of 2 months were approximately doubled those at the end of 1 month and 30% higher than those at 3 months. This observation appears to suggest that as the animals get older, the activity of complex IV and possibly all of the electron transport chain proteins change. Noting that the assays were performed with a fixed overall concentration of mitochondrial protein, the changes in Vmax might be reflecting changes in the concentration of complex IV relative to other mitochondrial proteins. This would be consistent with the findings of Thorburn [31] who reported increased mitochondrial concentration as children got older but decreased concentrations in the aged. In addition, the increased Vmax of the controls after 2 months could be indicating that at different stages in the life span of the rat, and possibly other animals, complex IV undergoes subtle transformations of its primary structure similar to those observed for hemoglobin which transforms from embryonic to fetal and finally to the adult form [32]. This possibility merits further investigation.
For the diabetic animals, however, the results of the polarographic assays (Fig. 2 and Tables 1 and 2) were not typical indicating that in these animals, oxygen utilization by complex IV was in some way affected. In the case of the liver, after just 1 month of the diabetic state, there was decreased activity of complex IV consistent with previous reports [19]. What had not been previously reported is that in addition to the inhibition, the biphasic kinetics normally exhibited by mitochondria (complex IV) under conditions of low ionic strength [24] was lost and replaced by a single straight line. For mitochondria from the diabetic kidney, whereas there was inhibition of complex IV at the 1-month period, the characteristics of the kinetics was retained (Fig. 2b). Taken together, the results are consistent with the known pathogenesis of DM; normally individuals suffering from the disease present with altered liver profiles many years before there are signs of kidney damage [2-5, 9-11, 17-19].
Perhaps our most striking observation was that after the initial period of inhibition, complex IV of both the liver and kidney appeared to have recovered its activity by the end of 2 months. We suspect that this might be related, at least in part, to the increased synthesis of the electron transport chain proteins after 2 months as proposed earlier but could also involve a specific up-regulation process aimed at restoring the oxygen utilization and by extension ATP synthesis in the early diabetic state. In this regard, our observation that there was an alteration to the protein content of mitochondria between 45 and 10 kd may be of significance and merits further investigation. Lu et al [19] reported DM-induced fluctuations of 37 mitochondrial proteins from islets; included among the 37 were electron transport chain proteins.
The fact that DM is characterised by high levels of glucose in the circulating blood could to a large extent explain the reports of low COX activity [17, 18] and also the uncharacteristic behavior now reported here. Several studies have shown that sustained high levels of glucose lead to the non-enzymatic glycosylation of the alpha subunit of hemoglobin [33] and also the non-enzymatic glycosylation of membrane lipids and membrane proteins [33, 34]. It is likely therefore, that in DM, portions of the mitochondrial membrane are glycosylated becoming more polar. Recall that cytochrome c, the substrate for COX has a significant number of lysine residues on its surface, conferring a net positive charge on the molecule [24]. That being the case, increased polarity of the membrane would strengthen the attraction between the membrane itself and cytochrome c and in so doing alter the way cytochrome c is able to interact with COX (Fig. 1). An altered cytochrome c-COX interaction could affect electron delivery by the former and as a consequence, oxygen utilization by the latter, manifesting itself as uncharacteristic Eadie-Hofstee plots. In addition, if the exposed extra-membrane region of COX becomes glycosylated as occurs with hemoglobin [33], this could have a direct impact on the functioning of complex IV and might for example inhibit the conformational changes considered to be critical for the enzyme’s mechanism of action [35], again leading to uncharacteristic kinetics.
Whereas the initial change at 1 month may have been linked to the altered structure of the membrane, it is likely that an additional factor might have contributed to the subsequent inhibition at 3 months. A poorly working COX, caused by alterations to the membrane, could produce ROS instead of water. These ROS could now damage COX, other electron transport proteins and the membrane as reported by others [9-11, 17-19, 34], further affecting oxygen utilization. On the basis of this study, it is not possible to say if ROS can cause DM; however, once the disease state exists, it can quickly lead to the production of ROS at complex IV setting in train or contributing to the wide range of complications that are known to be associated with the disease [2-5].
Conflicts of Interest
The authors declare no conflicts of interest.
Funding
We have not received any funding or grants for this study.
| References | ▴Top |
- Alberti KG, Zimmet PZ. Definition, diagnosis and classification of diabetes mellitus and its complications. Part 1: diagnosis and classification of diabetes mellitus provisional report of a WHO consultation. Diabet Med. 1998;15(7):539-553.
doi - Fowler MJ. Microvascular and macrovascular complic ations of diabetes. Clin Diabetes. 2008;26(2):77-82.
doi - Zhang W, Liu H, Al-Shabrawey M, Caldwell RW, Caldwell RB. Inflammation and diabetic retinal microvascular complications. J Cardiovasc Dis Res. 2011;2(2):96-103.
doi pubmed - Behnam RM. Microvascular complication of diabetes. J Biol Sci. 2010;10(5):411-423.
doi - Donahue RP, Orchard TJ. Diabetes mellitus and macrovascular complications. An epidemiological perspective. Diabetes Care. 1992;15(9):1141-1155.
doi - Mathers CD, Loncar D. Projections of global mortality and burden of disease from 2002 to 2030. PLoS Med. 2006;3(11):e442.
doi pubmed - International Diabetes Federation. IDF diabetes atlas [article online], 2013. Available from: http://www.idf.org/diabetesatlas/scientific-papers/papers. Accessed 12 August 2016.
- Diagnosis and classification of diabetes mellitus. Diabetes Care. 2012;35(Suppl 1):S64-71.
doi pubmed - Giacco F, Brownlee M. Oxidative stress and diabetic complications. Circ Res. 2010;107(9):1058-1070.
doi pubmed - Hayakawa M, Kuzuya F. [Free radicals and diabetes mellitus]. Nihon Ronen Igakkai Zasshi. 1990;27(2):149-154.
pubmed - Oberley LW. Free radicals and diabetes. Free Radic Biol Med. 1988;5(2):113-124.
doi - Ebenhoh O, Heinrich R. Evolutionary optimization of metabolic pathways. Theoretical reconstruction of the stoichiometry of ATP and NADH producing systems. Bull Math Biol. 2001;63(1):21-55.
doi pubmed - Althoff T, Mills DJ, Popot JL, Kuhlbrandt W. Arrangement of electron transport chain components in bovine mitochondrial supercomplex I1III2IV1. EMBO J. 2011;30(22):4652-4664.
doi pubmed - Hatefi Y. The mitochondrial electron transport and oxidative phosphorylation system. Annu Rev Biochem. 1985;54:1015-1069.
doi pubmed - Kalogeris T, Bao Y, Korthuis RJ. Mitochondrial reactive oxygen species: a double edged sword in ischemia/reperfusion vs preconditioning. Redox Biol. 2014;2:702-714.
doi pubmed - Arnold S. The power of life - cytochrome c oxidase takes center stage in metabolic control, cell signalling and survival. Mitochondrion. 2012;12(1):46-56.
doi pubmed - Coughlan MT, Thorburn DR, Penfold SA, Laskowski A, Harcourt BE, Sourris KC, Tan AL, et al. RAGE-induced cytosolic ROS promote mitochondrial superoxide generation in diabetes. J Am Soc Nephrol. 2009;20(4):742-752.
doi pubmed - Chen Q, Vazquez EJ, Moghaddas S, Hoppel CL, Lesnefsky EJ. Production of reactive oxygen species by mitochondria: central role of complex III. J Biol Chem. 2003;278(38):36027-36031.
doi pubmed - Lu H, Koshkin V, Allister EM, Gyulkhandanyan AV, Wheeler MB. Molecular and metabolic evidence for mitochondrial defects associated with beta-cell dysfunction in a mouse model of type 2 diabetes. Diabetes. 2010;59(2):448-459.
doi pubmed - Kadenbach B, Jarausch J, Hartmann R, Merle P. Separation of mammalian cytochrome c oxidase into 13 polypeptides by a sodium dodecyl sulfate-gel electrophoretic procedure. Anal Biochem. 1983;129(2):517-521.
doi - Tsukihara T, Aoyama H, Yamashita E, Tomizaki T, Yamaguchi H, Shinzawa-Itoh K, Nakashima R, et al. The whole structure of the 13-subunit oxidized cytochrome c oxidase at 2.8 A. Science. 1996;272(5265):1136-1144.
doi pubmed - Hill BC. Modeling the sequence of electron transfer reactions in the single turnover of reduced, mammalian cytochrome c oxidase with oxygen. J Biol Chem. 1994;269(4):2419-2425.
pubmed - Paula S, Sucheta A, Szundi I, Einarsdottir O. Proton and electron transfer during the reduction of molecular oxygen by fully reduced cytochrome c oxidase: a flow-flash investigation using optical multichannel detection. Biochemistry. 1999;38(10):3025-3033.
doi pubmed - Ferguson-Miller S, Brautigan DL, Margoliash E. Correlation of the kinetics of electron transfer activity of various eukaryotic cytochromes c with binding to mitochondrial cytochrome c oxidase. J Biol Chem. 1976;251(4):1104-1115.
pubmed - Speck SH, Dye D, Margoliash E. Single catalytic site model for the oxidation of ferrocytochrome c by mitochondrial cytochrome c oxidase. Proc Natl Acad Sci U S A. 1984;81(2):347-351.
doi pubmed - Sampson V, Alleyne T. Cytochrome c/cytochrome c oxidase interaction. Direct structural evidence for conformational changes during enzyme turnover. Eur J Biochem. 2001;268(24):6534-6544.
doi pubmed - Wu KK, Huan Y. Streptozotocin-induced diabetic models in mice and rats. Curr Protoc Pharmacol. 2008;Chapter 5: Unit 5.47.
doi - Alleyne T, Adogwa A, Lalla A, Joseph J, John R. Novel mitochondrial proteins and decreased intrinsic activity of cytochrome-c oxidase. Characteristics of swayback disease in sheep. Mol Chem Neuropathol. 1996;28(1):285-293.
doi pubmed - Yonetani T. Studies on cytochrome oxidase III. Improved preparation and some properties. J Biol Chem. 1961;236(6):1680-1688.
pubmed - Mohan N, Alleyne T, Joseph J, Adogwa A. Low activity and poor membrane tethering for rabbit brain cytochrome C oxidase in cholesterol-copper Alzheimer's model. J Mol Neurosci. 2009;38(3):273-279.
doi pubmed - Thorburn DR. Practical problems in detecting abnormal mitochondrial function and genomes. Hum Reprod. 2000;15(Suppl 2):57-67.
doi pubmed - He Z, Lian L, Asakura T, Russell JE. Functional effects of replacing human alpha- and beta-globins with their embryonic globin homologues in defined haemoglobin heterotetramers. Br J Haematol. 2000;109(4):882-890.
doi pubmed - Miller JA, Gravallese E, Bunn HF. Nonenzymatic glycosylation of erythrocyte membrane proteins. Relevance to diabetes. J Clin Invest. 1980;65(4):896-901.
doi pubmed - Zhang EY, Swaan PW. Determination of membrane protein glycation in diabetic tissue. AAPS PharmSci. 1999;1(4):27-33.
doi pubmed - Antonini E, Brunori M, Colosimo A, Greenwood C, Wilson MT. Oxygen "pulsed" cytochrome c oxidase: functional properties and catalytic relevance. Proc Natl Acad Sci U S A. 1977;74(8):3128-3132.
doi pubmed
This article is distributed under the terms of the Creative Commons Attribution Non-Commercial 4.0 International License, which permits unrestricted non-commercial use, distribution, and reproduction in any medium, provided the original work is properly cited.
Journal of Endocrinology and Metabolism is published by Elmer Press Inc.